Adding Category Summary
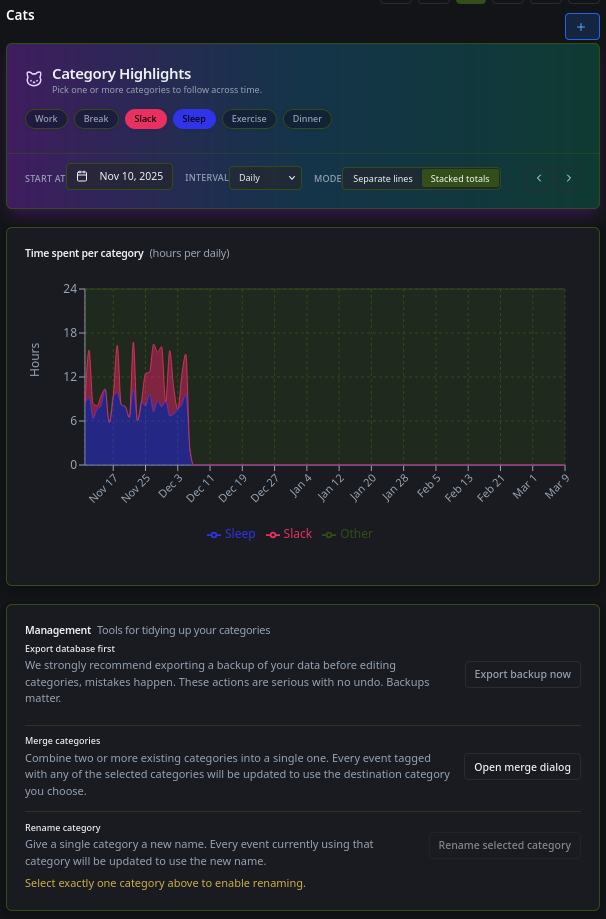
I added a cats page, which allows you to show the number of hours each day doing individual categories on a graph of days or weeks or years if you have enough data.
It also has category management sections, allowing merging and renaming of the categories to optimize data for stats.
For instance, here in my own personal data:

We see that through September and October I was in a routine of work and slack with a bit of social a couple of times a week until the end of November when I went away for social all weekend, saw a demo of a person using Shakespeare, and then when I got back started doing some vibe-coding, in Red.
A break from that to go away at the weekend then finish it off and publish a few days ago since when Vibe Coding has dropped off a little.