Category Graph Zoom
V0.1.12 -
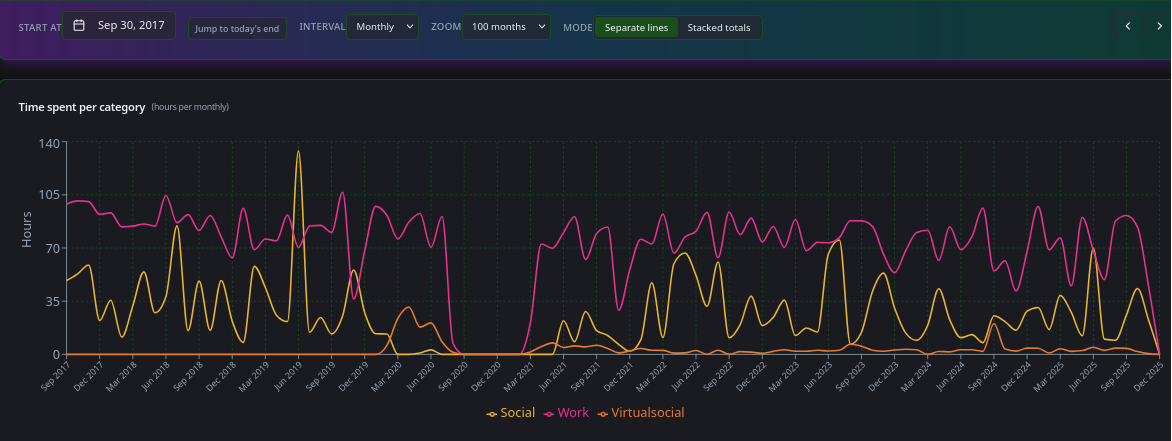
We add a zoom drop-menu for the Categories graph, this enables a lot more control over the way the graph is displayed.
Looking back at my own data the last 100 months we can see in general I’m quite seasonal. Festivals are a lot of social all weekend, and a couple of them in a month really bumps up the hours spent socialising.
The peak in 2019 is a summer filled with Glasto and Noisily and another festival or camping trip I don’t seem to have recorded the name of.
Then the drop-off in social activity as the COVID pandemic hit. Virtual-Social (IE zoom meetings and the like) picked up quite a bit around there but had died back to almost nothing way before the hours spent with actual people started to tick up.
Annoyingly, I have my biggest gap in data right on top of the pandemic there where I failed to back up much and then data became corrupted.
When the data-hole is over we see social life still not really returning until the middle of 2021 and not really getting back into stride until summer 2022.
Remains much lower on average with lower peaks than before the pandemic. Multiple reasons.
Work is pretty constant all the way though other than the data-hole. Dipping when I take time off for social mostly.
That data-hole is annoying. Back up your data kids.